Power BI is a software created by Microsoft that promises to be an easy to handle Business Intelligence tool for the end users, but first to understand with more details what exactly is Microsoft Power BI, we need to understand what is the “BI” part of it.
Right… so what is Business Intelligence?
Business Intelligence can be explained by the processes, analysis and technologies used by the companies when someone need to do a data analysis with the businesses information.
Lets speak English here… Every time you create a report on excel based on various information from different files, exports from ERP systems etc, you are doing Business Intelligence.
The process of Business Intelligence can be basically divided into the following steps:
1 – Access
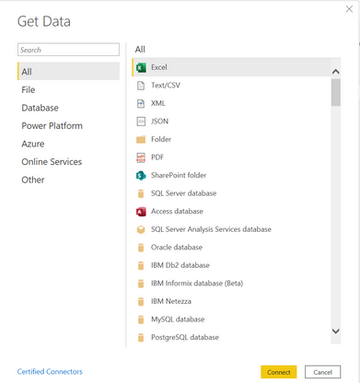
The ability to connect to data that is in different systems and locations. This can be an excel file, csv, ERP info, SQL Database, Cloud etc.
2 – Clean
Usually the data does not come the way you want it, so this step is when you do some transformations in order to make the data clean enough and make sure that there are no errors in the database
3 – Mash-Up
Maybe when you read the “access” step you thought to yourself “I use all of them!” and that is when the Mash-up step comes in hand. This step is when we relate tables from different sources in order to bring the best of our data.
4 – Explore
Once you have all the data imported, cleaned and related it’s time to explore the data. This is the step where you can drill-down, slice and dice your data to find insights and trends. Also is a key step to validate business rules and find errors that were not found on the Clean step.
5 – Visualize
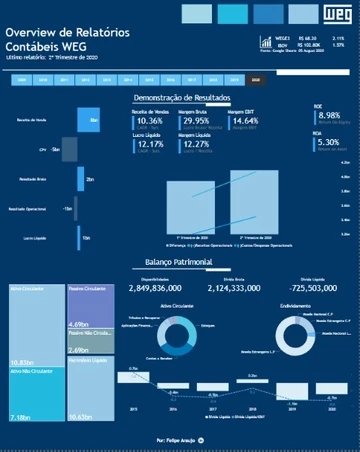
Data Visualization is an art on its own and once you identified what you wanted to show exploring the data, it’s time to make it visual for the end user in a way that it’s easily digestible. With different visuals for the same data you can tell two different stories, that is why data visualization is so important.
6 – Share
After 5 long steps working with your data, its time to share it with your stakeholders so the business can take the best our of the BI analyst work.
Why am I explaining this to you? Well, Microsoft Power BI can do all of these steps, and once they are well mapped there is no need to work on all of them again for a report Refresh.
No more hours lost on excel doing v-lookups, or copying and pasting 100 different versions of the same file from past periods, with Power BI we can have all of that in just one report that refreshes itself when necessary.
How Power BI does the Job?
In Power BI we can do all of the steps mentioned above, you can access data from a variety of different sources like SaaS services, internal data, Azure and On-Premises data sources, files etc

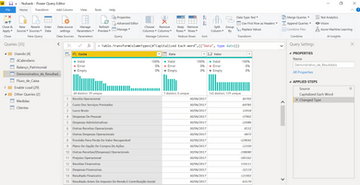
The Clean step is done on Power Query. Power Query is the part of Power BI where you can transform your data to fit your needs, merge and append queries to combine data, remove errors, cleanse the data, filter specific rules etc.
There is no necessity to do any manual work, we can automate any type of data handling on Power Query.

With merging and appending queries, Power Query can also do mash-up of your data when necessary. We also create all the relationships on the Model view of Power BI, where we relate all the keys from the table in order to bring the correct information from the correct table.

And last but not least with Power BI Online, you can share your reports with all of your stakeholders so they can see the amazing job done with the tool.


